


BLOCKBUSTERS
N
O
I
S
S
E
C
E
R
Case Study By Jason Clark
About this Project
Recession Blockbusters explores how economic downturns shape the stories audiences turn to in theaters. Drawing on U.S. box office data from 2000–2023, this case study traces the connection between recession cycles and the emotional tones of hit films- revealing how cinema meets deeper cultural needs when times are hardest.
The annual studio release slate has remained broadly consistent across the study period (≈160–170 films per year). What changed was exhibition practices: theatrical windows shortened- from roughly 12+ weeks in the 2000s to about 6–8 weeks by the 2020s-and major releases now often occupy 2–3 formats in the same multiplex (IMAX, Dolby/XD, plus a standard auditorium). That reduces the number of unique films shown at once and can shorten runs for smaller titles, while disproportionately capturing the five-week gross of films spread across multiple formats compared with a title restricted to one screen during the same release window.
During 2020–2022, several titles also released under day-and-date or ~45-day theatrical windows, which depress theatrical “legs” relative to earlier years.
Seasonality- not controlled for in this analysis; holiday releases versus midsummer tentpoles behave differently in both openings and holds.
Sample size- some emotional tones have small film counts; their payoff estimates carry higher variance and should be read as directional, not definitive.
Exclusions- special-format IMAX events and all theatrical re-releases were removed. These screenings often reflect nostalgia- or format-driven attendance rather than underlying emotional tone. Excluding them keeps comparisons focused on first-run titles.
Bias&
Shortcomings
Shortcomings
Data acquisition- Film metadata and grosses were retrieved via the OMDb API, which provided consistent coverage of titles, release years, and core attributes. To supplement gaps and capture box-office dynamics at the weekly level, additional records were scraped from public box-office tables using a Python/Playwright pipeline. Parsing routines converted raw HTML into structured tables with release dates, weekly grosses, and theater counts. This dual approach ensured full coverage of ~4,000 U.S. first-run films while standardizing the variables needed for stress tagging, classification, and modeling.
Tone classification- Primary and secondary tones were assigned by a GPT-based classifier built with the OpenAI API, guided by the nine-tone taxonomy. The classifier did not rely on external plot or marketing fields; instead, it drew on GPT’s internal film knowledge and semantic reasoning. For well-known titles, GPT classified directly from title context. For obscure or ambiguous films, the system incorporated fallback logic.
Multiple GPT model passes acted as peer checks to reduce drift, and a human QC process spot-checked 5–10% of titles to achieve 90-95% accuracy. This workflow ensured consistency across +4,000 first-run releases, yielding both primary and secondary tone assignments.
Stress flagging- Each film was tagged with two indicators of economic strain at the time of release. First, NBER recession periods, pulled from the FRED database, provided an on/off (binary) measure of contraction. Second, the Conference Board’s Consumer Sentiment Index (CSI) supplied a monthly stress score. To make interpretation comparable across decades, CSI was binned into three bands: High Stress < 80, Elevated = 80–99, and Normal ≥ 100. These flags were merged into a single stress_level field, so every release could be analyzed in relation to both formal recessions and audience sentiment at the moment of opening.
Data cleaning- Initial classifier outputs and box-office data were consolidated with Power Query into a master file. Titles were deduped, non-theatrical re-releases and IMAX-only events were excluded, and fields were standardized for modeling.
Statistical modeling- To test how tones performed under different economic conditions, we estimated linear models of five-week real gross. Predictors included opening theaters and its interaction with stress level, primary emotional tone × stress interactions, and a control for sentiment at release. These models confirmed both the diminishing returns of scale under stress (≈ –$4.7K per theater, p = 0.02) and the significance of tone–stress effects (p < 0.05 for several interactions). Outputs included distributional summaries, supply-bias matrices, volatility measures, and coefficients- each are documented in the
R Appendix.
Composite payoff- In addition to modeled gross uplift, a mean_rating_effect metric was constructed by converting IMDb, Rotten Tomatoes, and Metascore uplifts into dollar-equivalent terms and averaging them with the regression results. This allowed emotional payoff and financial performance to be compared in the same unit.
Presentation- Outputs were exported as 10 CSVs and visualized in Tableau dashboards, assets were prototyped in Figma, and embedded within this site via Tilda for narrative presentation.
Methodology
VS Code + Python- VS Code was the main coding environment. Python handled scraping, parsing, and data wrangling — pulling box-office records, shaping raw tables, and consolidating metadata. ChatGPT was used directly inside this workflow for coding assistance, debugging, and refining logic.
GPT API- A custom classifier built on the GPT API assigned primary and secondary tones to ~4,000 films, using the nine-tone taxonomy. Multiple model passes and “peer checks” improved consistency across the dataset.
Excel + Power Query- Excel supported quick reviews and manual cleanup of CSVs. Power Query extended this work with pivots and more complex consolidations, producing a single master dataset ready for modeling.
R- R was used to test hypotheses statistically. Regression models quantified tone × stress effects, volatility measures, and supply bias. This gave each conclusion a mathematical foundation documented in the R appendix.
Tableau Desktop- Tableau translated statistical outputs into interactive dashboards, weaving them into a narrative visual story that revealed resonance, supply, and payoff patterns.
Figma + Wondershare Filmora- Figma prototyped the visual assets (tone bar, card layouts) and produced expanded tone-definition cards. Filmora added ~90-second bespoke video clips into those cards, pairing each tone with a representative film “trailer.”
Tilda- Finally, Tilda tied it all together, housing the dashboards, text, and media in a cohesive, scroll-based case study site.
tools used
Emotional and Technical Reference
DEFINITIONS


Panic Room (2002)
Stress Period: Normal
Stress Period: Normal
Gravity (2013)
Stress Period: High
Stress Period: High
Inception (2010)
Stress Period: High
Stress Period: High
I Am Legend (2007)
Stress Period: High
Stress Period: High
Ghostbusters: Afterlife (2021)
Stress Period: High
Stress Period: High
Despicable Me (2010)
Stress Period: High
Stress Period: High
Black Panther: Wakanda Forever (2022)
Stress Period: High
Stress Period: High
Top Gun: Maverick (2022)
Stress Period: High
Stress Period: High


Technical Reference
Release Month
First-of-month version of release date.
💡 Used to join films cleanly to CPI and consumer sentiment data.
CPI (Release Date)
Consumer Price Index (CUUR0000SA0, unadjusted) for the release month.
💡 Converts nominal grosses into real 2023 dollars.
Sentiment at Release
CSI- Consumer Sentiment Index (UMCSENT) value for the release month.
💡 Reflects audience optimism or caution at the time of release.
NBER Flag
Binary indicator: 1 if month is in an NBER-defined recession.
💡 Anchors box office context to official U.S. recession periods.
Economic Stress Indicator
Composite flag: 1 if NBER=1 or sentiment ≤ 80.
💡 Captures downturn psychology even outside official recessions.
Week 5 Gross (Five-Week Revenue):
Total nominal domestic gross earned in the first five weeks of release.
💡 Core window used to measure early tone performance under stress.
5-Week Real Gross:
Week 5 Gross adjusted for inflation using CPI (2023 dollars).
💡 Normalizes across decades so emotional payoffs are directly comparable.
Annual Real Domestic Gross:
Full domestic box office run, CPI-adjusted to 2023 dollars.
💡 Captures long-tail outcomes beyond the opening window.
Box Office Multiple (Legs Factor):
Total gross ÷ opening weekend gross.
💡Indicates whether success was fleeting hype or lasting word-of-mouth.
Week 2 Hold %:
Second-week gross ÷ opening weekend gross.
💡 A sharper drop means weaker retention; a strong hold signals legs.
W2 Ticker:
Internal shorthand for Week 2 Hold % trend in tooltips/plots.
💡 Provides a quick visual cue for early momentum in Tableau
Mean Rating Effect (MRE):
Average of modeled uplift and rating-based uplift, expressed in 2023 $M.
💡 Translates audience emotion into dollar terms for clean comparison.
AGE (Average Gross Effect):
Modeled estimate of incremental 5-week gross attributable to tone.
💡 Isolates emotional lift beyond ordinary box office drivers.
Gross Estimate (Lift $):
Dollar uplift in 5-Week Real Gross during stress vs. baseline.
💡 Quantifies payoff in absolute financial terms.
Lift % (Relative Lift):
Percentage version of gross uplift.
💡 Shows proportional advantage (or weakness) of a tone under stress..
Volatility:
Year-to-year instability of a tone’s performance.
💡 Signals sensitivity to supply or audience mood shifts.
PaM (Predict-at-Median):
Regression framework that measures stress–normal payoff differences while holding covariates like opening scale and sentiment at their medians. Converts modeled betas into 2023 $M to dollarize payoff gaps.
💡 Provides a controlled baseline to compare how tones perform under stress vs. normal conditions.
Yield:
Average realized gross per film within a tone/year, in 2023 $M. Formula: total real gross ÷ number of films.
💡 Captures the “per-film weight” of a tone’s box office presence, independent of uplift modeling.
Box Office Efficiency:
Incremental payoff per film in a tone, expressed in 2023 $M. Formula: Gross Estimate uplift ÷ number of films.
💡 Shows how effectively each film in a tone converts opportunity into added box office payoff.
Supply Bias:
Difference between a tone’s release share and its payoff share. Positive = oversupplied; negative = undersupplied.
💡 Reveals mismatches between what studios put on screens and what audiences valued emotionally.
How confidence and downturns reshape box office outcomes
Mood & Stress
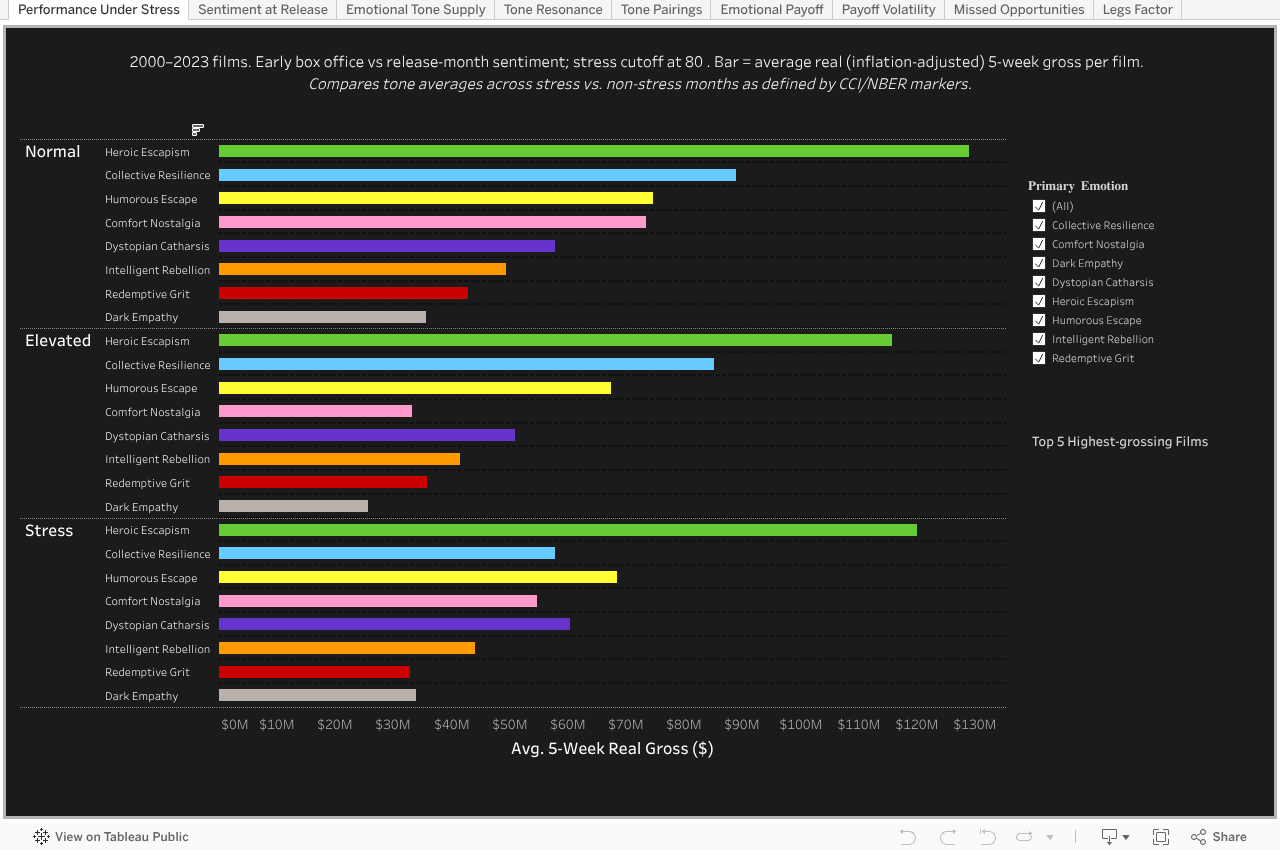
Stress reshuffles winners: Heroic Escapism holds steady, but audience “comfort” (Nostalgia, Resilience) falters when people are under pressure
Average 5-Week Gross by Tone (Stress vs. Normal)
Performance Under stress
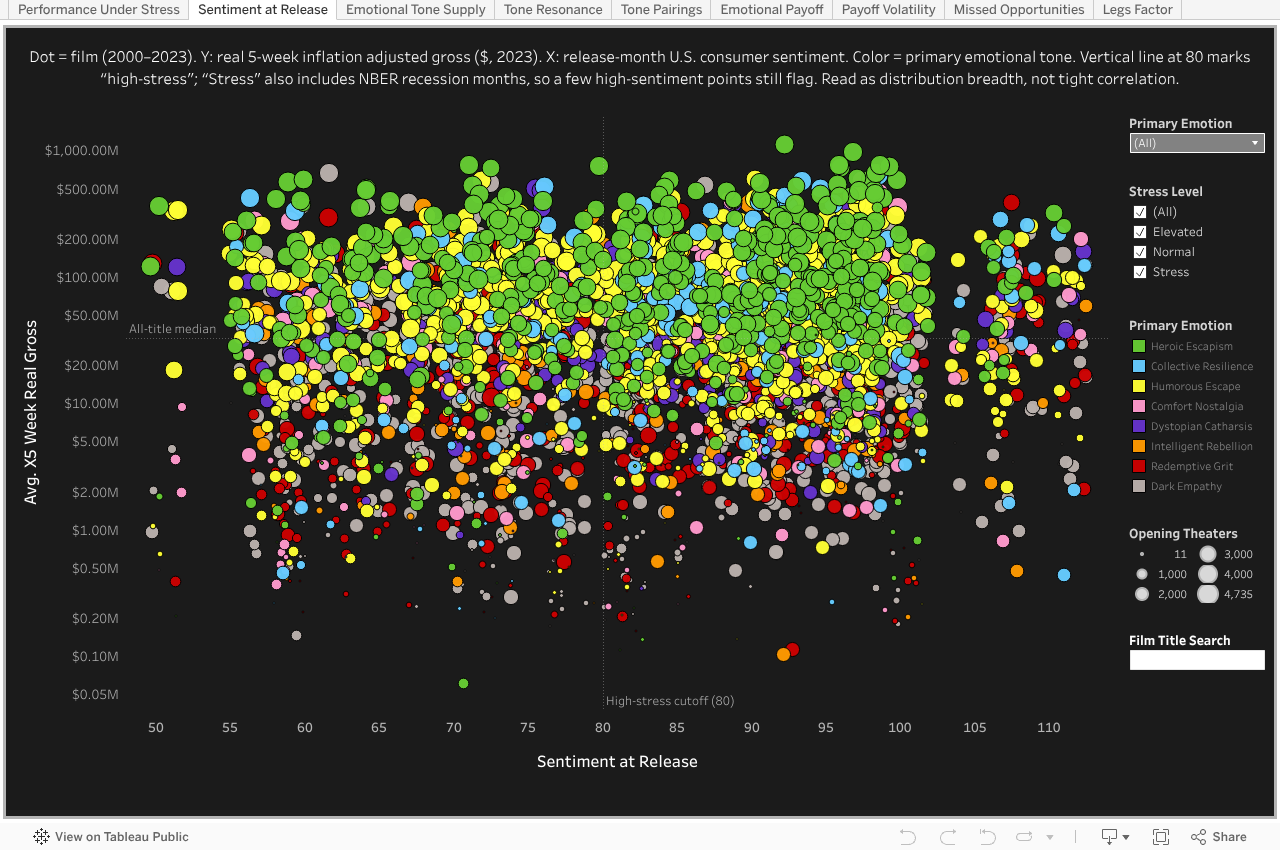
The scatter shows box office strength isn’t linearly tied to sentiment—big films launch in all moods—but stress markers still slice outcomes, proving economic psychology matters beyond correlation
Avg 5-Week Real Gross × Sentiment at Release
Sentiment at Release
Release patterns, audience response, and the gap between them.
Supply & Resonance
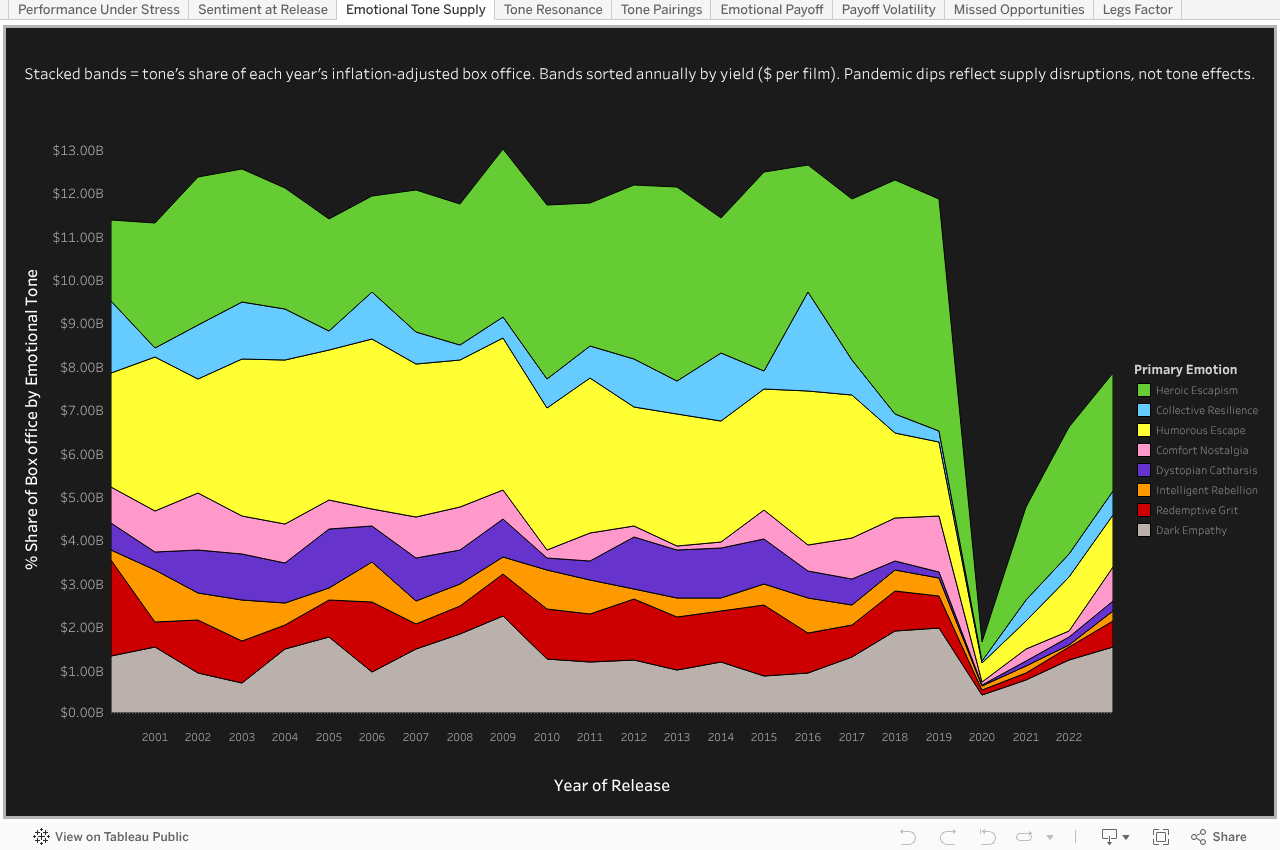
Despite yield shifts and crises, tone supply stays surprisingly formulaic — a fixed slate mix that often ignores emerging audience signals, foreshadowing the under- and oversupply patterns revealed under stress.
Tone Supply
Annual Box Office Share by Emotional Tone (Real $, %)
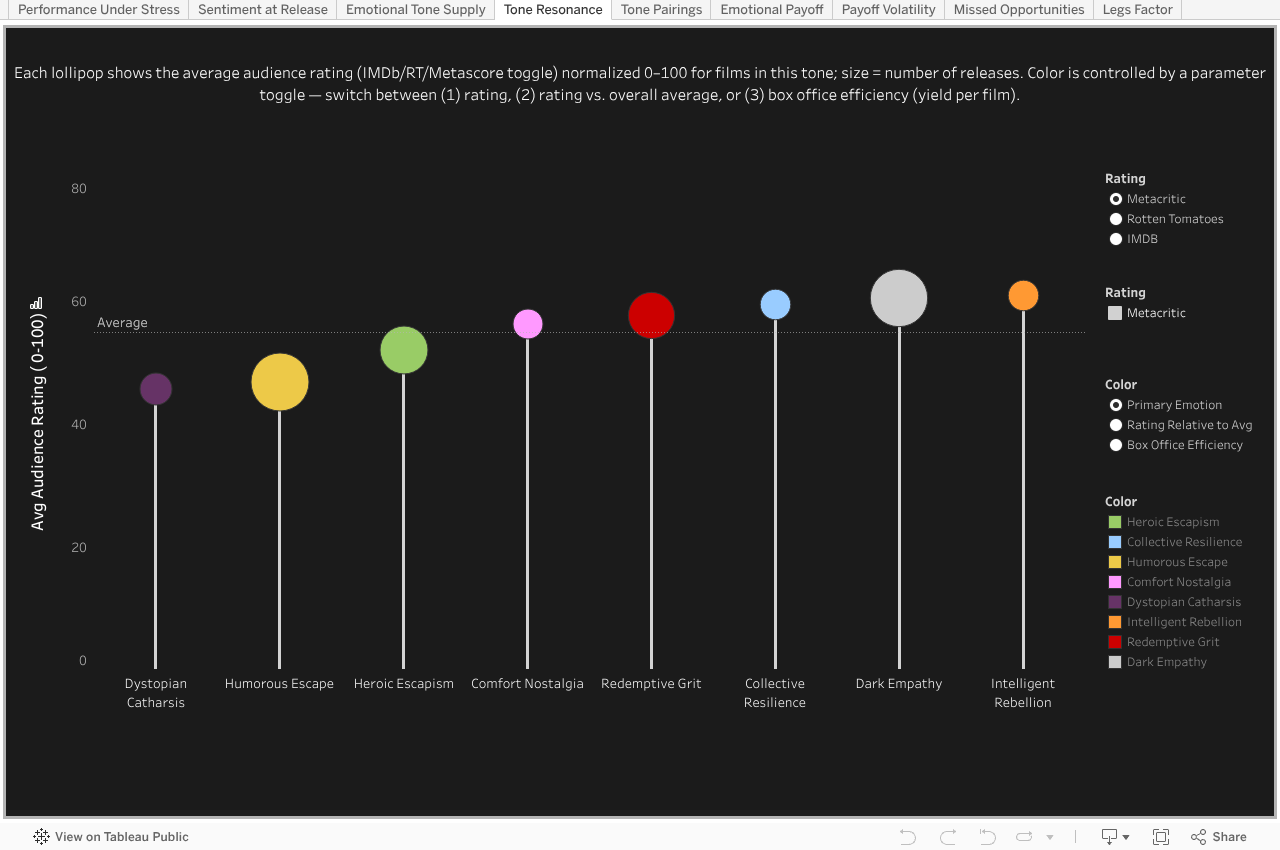
Studios didn’t consistently supply what audiences rated highest — except Dark Empathy, which got both share and strong ratings. Overall, supply more closely mirrored box office efficiency than resonance.
Avg Audience Rating (0–100) × Primary Emotional Tone
Tone Resonance
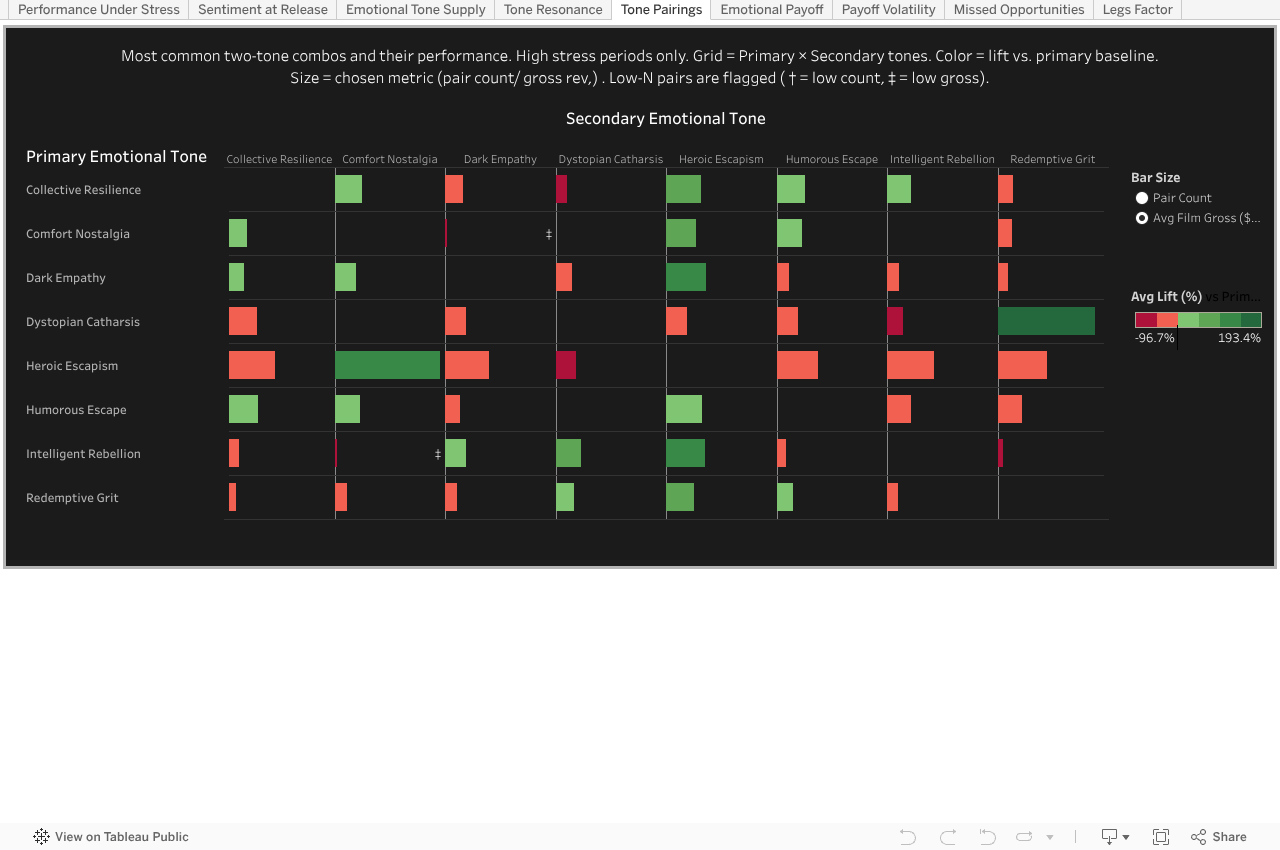
Heroic Escapism delivered consistent lift across nearly every measure, with a mid-level supply that outperformed higher-volume tones like Redemptive Grit. Yet even here, the strongest pairings weren’t the ones most supplied — showing studios favored formula over performance and foreshadowing the missed opportunities ahead.
Emotional Tone Pairings Matrix Under Stress
Tone Pairings
Where emotion translates into measurable box office lift
Emotional Payoff
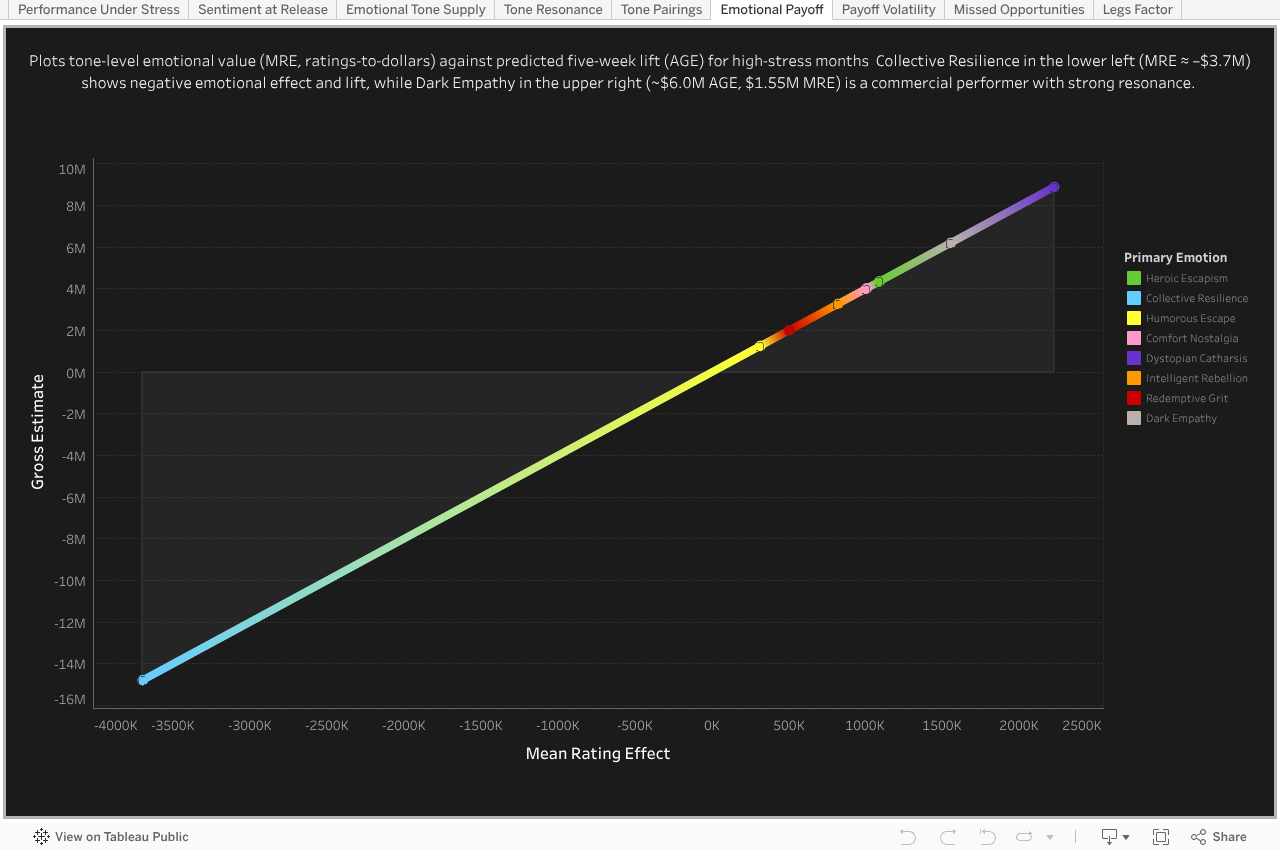
Here we ask which tone improves its performance relative to baseline when the economy is stressed. Dark Empathy and Dystopian Catharsis outperform expectations under stress, but their low yields are a function of oversupply — studios leaned too heavily into them, diluting otherwise strong payoff.
Emotional Payoff Under Stress (MRE vs. AGE)
Emotional Payoff
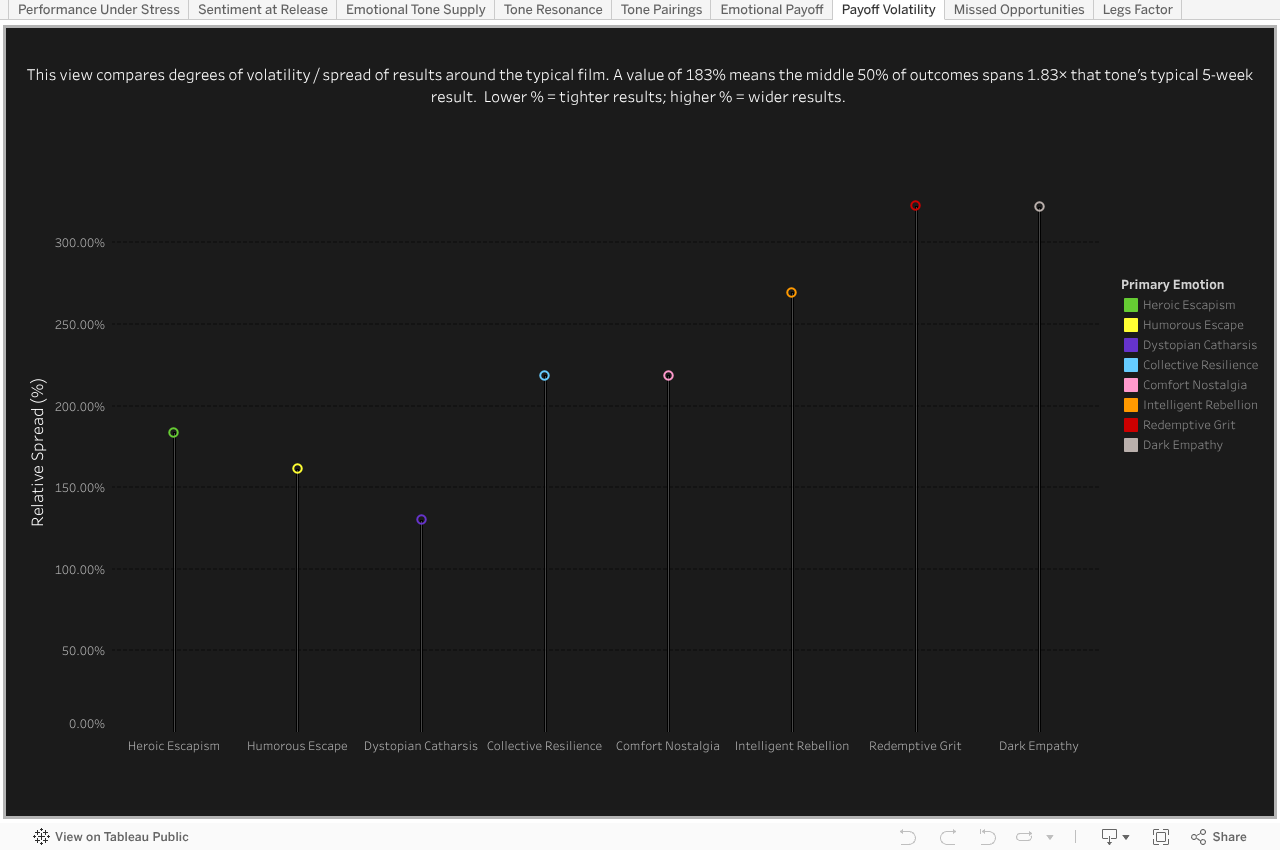
Redemptive Grit and Intelligent Rebellion are the riskiest bets under stress, with results swinging more than 2.5× their median film. Dystopian Catharsis, Comfort Nostalgia, and Humorous Escape prove steadier, clustering tightly around predictable returns. Heroic Escapism sits in the middle — not the safest, not the wildest — reinforcing its role as a reliable performer that studios still didn’t fully capitalize on.
Relative Outcome Spread Under Stress (IQR ÷ Median 5-Week Gross)
Emotional Payoff — Volatility Profile
Seeing risk in oversupply and reward in overlooked tones
Risk & Opportunity
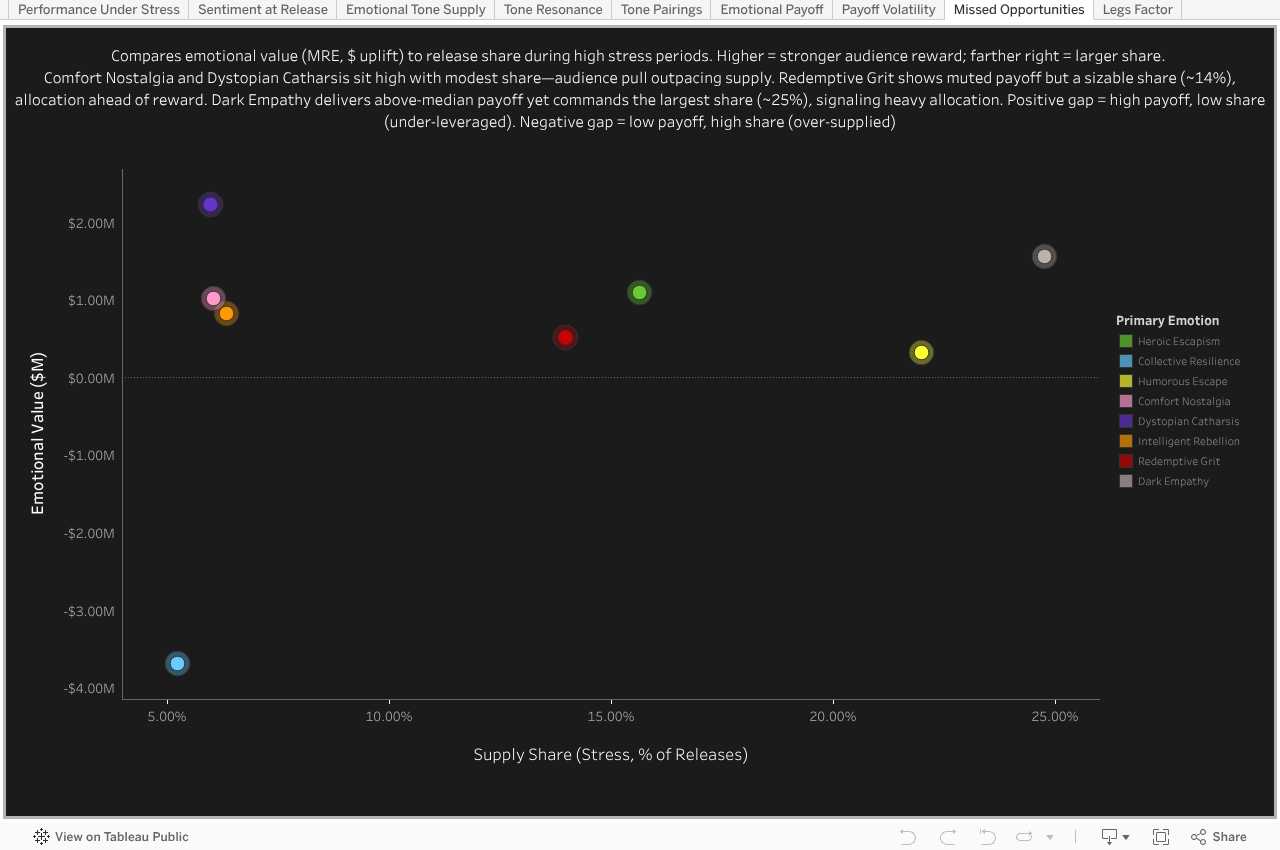
The tones audiences most rewarded (Comfort Nostalgia, Dystopian Catharsis) were the ones least supplied—evidence that recession strategy left money and connection on the table. At the same time, Redemptive Grit absorbed far more share than its muted payoff justified, showing not just bias but misallocation that actively crowded out more resonant tones.
Supply vs Emotional Value
Missed Opportunities
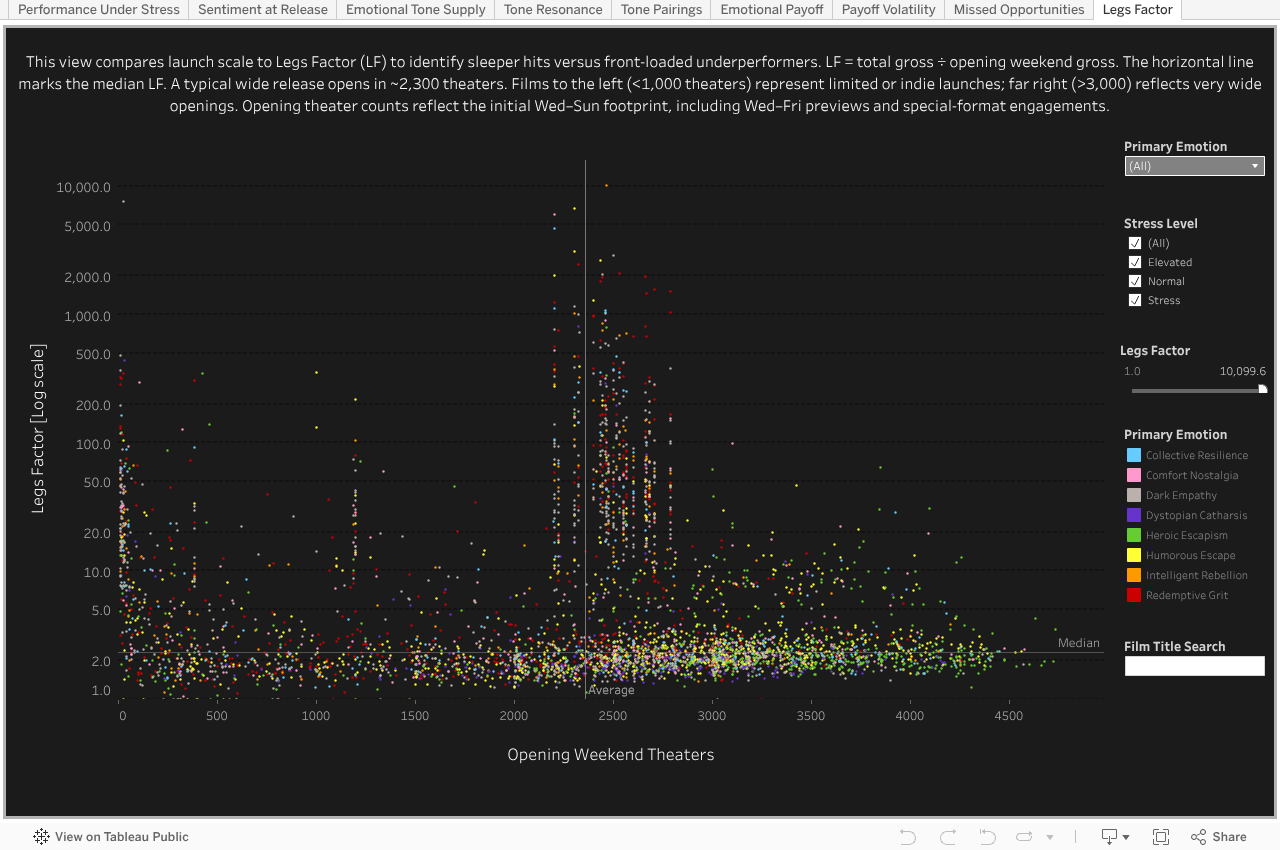
Box office endurance isn’t just about scale — stress conditions weaken the payoff of wide openings, making emotional tone a decisive factor. Small resonant films like Won’t You Be My Neighbor out-legged mega-launches like Morbius. In downturns, Legs Factor reveals which tones can steady outcomes when size loses its edge.
Which Films Outlast Their Opening?
Legs Factor
What Endures When Stress Hits
The Closer
Stress doesn’t erase demand — it reshapes it. Studios that win aren’t those who release more, but those who release smarter
Across high-stress months, Dark Empathy and Dystopian Catharsis punched above their baselines, while Comfort Nostalgia and Heroic Escapism proved the most reliable throughlines. Yet supply stayed anchored to efficiency and habit, not resonance, leaving misallocations that could have been avoided. Volatility exposed risky tones that burned out quickly, while steadier ones were under-leveraged. When stress weakens the edge of wide openings, tone — not scale — becomes decisive. A slate aligned with stress-era payoffs would have delivered steadier returns, stronger audience match, and fewer missed opportunities.
- Psychology matters: Stress signals (CCI/NBER) sort outcomes more sharply than mood–gross correlations alone.
- Supply ≠ resonance: Studios leaned on efficiency and habit; audience reward often sat elsewhere.
- Relative winners under stress: Dystopian Catharsis and Dark Empathy punched above baseline; Comfort Nostalgia and Heroic Escapism held steady.
- Risk profile: Volatility separates tones that are stable anchors from those that swing wildly and burn out fast.
- Supply balance: Some tones lose strength when oversupplied (dilution), while others remain under-leveraged despite steady payoff.
- Scale weakens under stress: Wide openings lose edge; tone drives who lasts (Legs Factor).
- Actionable fix: Rebalance toward tones with positive stress payoff and lower volatility, and rethink pairings where best lift ≠ most supplied
Shifting even a modest slice of the slate toward stress-resilient tones is the difference between weathering the storm and chasing the burnouts.
